WHP to HP Calculator
Convert a dyno's wheel horsepower into crank horsepower, or the other way round, with typical drivetrain loss for every layout. Enter both figures and it works out your own loss.
Press Calculate to print your slip
Estimate only. Real numbers vary with the dyno, the track and the day.
Got your crank figure? Run it through the 0-60 Calculator
On this page
Dyno numbers, made comparable
A dyno measures power at the tires. A manufacturer quotes it at the engine. Between the two sits the gearbox, driveshaft, differential and axles, and they all take a cut. This calculator bridges the gap in both directions and can tell you what your own driveline is losing.
What you need
- A power figure
- Wheel horsepower from a dyno sheet, crank horsepower from a spec sheet, or both if you want your real loss.
- Your layout
- RWD, FWD or AWD, motorcycle or EV. Each has a typical loss you can override.
What you get
- Crank horsepower from a dyno number, or wheel horsepower from a rating
- How much power the driveline eats, in hp and percent
- The same figure in kilowatts and PS
- Whether your measured loss is normal for your layout
What drivetrain loss is
Every gear mesh, bearing, seal and joint between the crankshaft and the road turns a little power into heat. Add the energy it takes to spin the flywheel, gearbox internals, driveshaft, wheels and tires up to speed, and the tires never see the full engine figure. That shortfall is drivetrain loss.
It isn't truly a fixed percentage. Some of the loss is constant friction and some rises with load and rpm. But a percentage of crank power is close enough for street cars, which is why it's the rule of thumb everyone uses.
Typical loss by layout
| Layout | Typical | Common range | Why |
|---|---|---|---|
| Rear-wheel driveLongitudinal engine, driveshaft, rear differential | 15% | 12 to 18% | Driveshaft and separate diff |
| Front-wheel driveTransverse engine, transaxle | 12% | 10 to 15% | Short path, no driveshaft |
| All-wheel driveTransfer case, two differentials | 20% | 18 to 25% | More gears, more shafts |
| MotorcycleChain final drive | 10% | 8 to 12% | Light, simple driveline |
| Electric vehicleSingle-speed reduction gear | 10% | 8 to 12% | One gear, no clutch |
Conventional torque-converter automatics tend to sit at the higher end of each range.
The formulas
Crank from wheel
HP = WHP ÷ (1 − loss)
Wheel from crank
WHP = HP × (1 − loss)
Your loss
loss = (HP − WHP) ÷ HP
- HP
- Crank (flywheel) horsepower, as the manufacturer rates it.
- WHP
- Wheel horsepower, as a chassis dyno measures it.
- loss
- Drivetrain loss as a decimal: 15% is 0.15.
- Other units
- 1 hp = 0.7457 kW = 1.014 PS.
Worked example: 255 whp on a rear-wheel-drive car with a 15% loss is 255 ÷ 0.85 = 300 crank horsepower, so the driveline is eating about 45 hp.
Why dyno numbers vary
Dyno type
Inertia dynos (Dynojet) usually read higher than load-bearing dynos (Mustang, Dynapack). The same car can show a 10% gap between the two.
Correction factor
SAE, STD and uncorrected figures differ by a few percent. Manufacturer ratings use SAE conditions, so compare like with like.
Strapping and tires
How tightly the car is strapped down and the tire pressure change rolling resistance, and so the reading.
Heat and weather
Hot intake air and heat-soaked engines make less power. A cool morning pull and a hot afternoon pull won't match.
Gear used
Most shops pull in the gear closest to 1:1. A different gear changes the losses and the number.
Optimistic ratings
Some factory ratings are conservative and some are generous, so a "high" measured loss can really be a low crank figure.
Real stock cars on the dyno
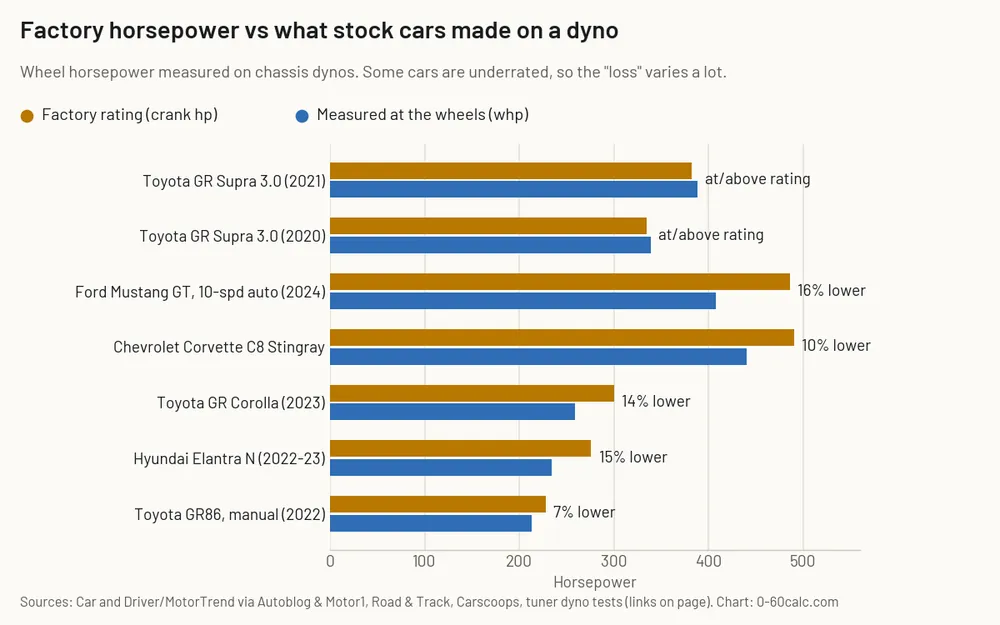
Typical drivetrain-loss percentages are averages. Here is what seven stock cars actually made at the wheels, compared with their factory crank ratings, from published dyno tests.
| Car | Factory hp | Wheel hp | Difference |
|---|---|---|---|
| Toyota GR Supra 3.0 (2021, auto)Car and Driver, via Motor1 | 382 | 388 | 2% higher |
| Toyota GR Supra 3.0 (2020)Car and Driver (Dynojet), via Autoblog | 335 | 339 | 1% higher |
| Ford Mustang GT (2024, 10-speed auto)Middleton Motorsports, via Motor1 | 486 | 408 | 16% lower |
| Chevrolet Corvette C8 StingrayCarlyle Racing (Dynojet), via autoevolution | 490 | 440 | 10% lower |
| Toyota GR Corolla (2023)Owner's car (Dynojet AWD), via Carscoops | 300 | 259 | 14% lower |
| Hyundai Elantra N (2022-23)Stillen tuner baseline | 276 | 234 | 15% lower |
| Toyota GR86 (2022, manual)JST Performance, 91 octane | 228 | 213 | 7% lower |
What this tells you. The Mustang GT and Elantra N lost 15 to 16 percent, right where the calculator’s defaults sit. The GR Supra made more at the wheels than Toyota claims at the crank, which means its factory rating is conservative, not that it has no drivetrain loss. The GR86 (7 percent) and C8 Corvette (10 percent) lost less than the usual rear-drive 15 percent, and the all-wheel-drive GR Corolla (14 percent) far less than the 20 percent AWD default. Dyno type matters too: in 2019 a MotorTrend dyno run of the C8 Corvette reported far more wheel horsepower than the car is rated for, a result other outlets disputed. So use the calculator’s percentage as a starting point, and trust a same-dyno before-and-after comparison over any single number.
For the full explanation of crank, brake and wheel horsepower, read WHP vs BHP vs HP.
How to use it
Pick a direction
Wheel to crank, crank to wheel, or find your own loss from both figures.
Choose the layout
Car with RWD, FWD or AWD, motorcycle or EV. This sets the typical loss.
Enter the power
Use the peak figure. Override the loss percentage if you know your driveline better than the preset.
Read the slip
Press Calculate. The slip shows the converted figure, the loss and the same power in kW and PS.
Example conversions
The same dyno reading means different crank power on different layouts, because the driveline loss differs.
| Dyno reading | Crank hp | Lost | In kW |
|---|---|---|---|
| 200 whp, RWD15% typical loss | 235 hp | 35 hp | 175 kW |
| 200 whp, FWD12% typical loss | 227 hp | 27 hp | 169 kW |
| 200 whp, AWD20% typical loss | 250 hp | 50 hp | 186 kW |
| 300 whp, RWD15% typical loss | 353 hp | 53 hp | 263 kW |
| 400 whp, AWD20% typical loss | 500 hp | 100 hp | 373 kW |
| 150 whp, Motorcycle10% typical loss | 167 hp | 17 hp | 124 kW |
Sources and method
Wheel and crank horsepower are linked by a drivetrain-loss percentage. The defaults (FWD 12%, RWD 15%, AWD 20%, motorcycles and EVs 10%) are typical figures, checked against the published dyno tests of stock cars on this page.
Updated September 2026. Built and checked by the 0-60calc Team. Found a mistake? Tell us and we will check it against the source.
More calculators
Once you have a crank figure, see what it means on the road.
0-60 Calculator
0-60 mph and 0-100 km/h from power and weight, for cars, motorcycles and EVs.
OpenQuarter Mile Calculator
1/4 and 1/8 mile ET and trap speed, or horsepower from a time slip.
OpenPower-to-Weight Ratio
lb/hp, kg/hp and hp per tonne, with a class comparison for cars and bikes.
OpenHorsepower Calculator
Horsepower from torque and rpm, a time slip or a 0-60 time, in hp, kW and PS.
OpenkW to HP Converter
Convert kilowatts to horsepower and PS, with a chart from 1 to 1,000 kW.
OpenPS to HP Converter
Convert metric horsepower (PS, CV) to hp, bhp and kW, with real European cars.
OpenG-Force Calculator
Average acceleration in g from any 0-60 or 0-100 km/h time.
OpenTire Speed Rating Chart
Every speed rating letter in mph and km/h, plus a sidewall code decoder.
OpenKM/H to MPH Converter
Convert kilometers per hour to miles per hour, with a full chart.
OpenMPH to KM/H Converter
Convert miles per hour to kilometers per hour, with a full chart.
OpenSpeed Calculator
Speed, distance or time from the other two, average speed and speed from rpm.
Open
Questions tuners ask
Is drivetrain loss really a fixed percentage?
Not physically. Part of the loss is fixed friction and part rises with load, so the true percentage changes with power and rpm. Percentages are a convenient rule of thumb that works well enough for street cars, which is why dyno shops and forums use them.
Why does a FWD car lose less than an AWD car?
Power takes a shorter path. In a FWD car the gearbox and differential sit in one unit next to the engine. AWD adds a transfer case, an extra driveshaft and a second differential, and every extra gear mesh and bearing costs a little power.
Is a Dynojet number the same as a Mustang dyno number?
No. Inertia dynos such as the Dynojet usually read higher than load-bearing dynos such as a Mustang or Dynapack for the same car. Compare runs from the same type of dyno, ideally the same dyno.
Should I enter SAE or STD corrected numbers?
Enter whatever the sheet shows, but stay consistent. SAE J1349 corrected figures are usually a few percent lower than STD or uncorrected figures, and manufacturer crank ratings are quoted to SAE standards.
What loss should I use for an automatic gearbox?
Traditional torque-converter automatics tend to lose a little more than manuals, especially on an inertia dyno. Start with the layout preset and add two or three percent if the car has a conventional automatic.
Can I use this for a motorcycle?
Yes. Choose Motorcycle and the calculator uses a 10% chain-drive loss, which suits most sport bikes. Shaft-drive bikes lose a little more.