0-60 Calculator
Estimate 0-60 mph, 0-100 km/h and quarter-mile times from power and weight. Works for cars, motorcycles and EVs.
Press Calculate to print your slip
Estimate only. Real times vary with traction, tires, weather and launch.
On this page
An estimate in 30 seconds
You don't need a stopwatch or a drag strip to know roughly how quick a vehicle is. Enter its power and weight, choose the drivetrain and gearbox, and the calculator turns that power-to-weight ratio into a 0-60 mph estimate, a 0-100 km/h time and a full quarter-mile slip.
What you need
- Power
- Rated crank horsepower, or wheel horsepower from a dyno sheet.
- Weight
- Curb weight for cars and EVs. Wet weight plus rider for bikes.
- Layout
- Drivetrain (RWD, FWD or AWD) and gearbox type.
What you get
- 0-60 mph and 0-100 km/h estimates
- 1/8 mile and 1/4 mile elapsed times with speeds
- Average acceleration in g and power-to-weight
- Live updates when you change any input, so you can test a tune or a lighter setup in seconds
What a 0-60 time tells you
A 0-60 mph time measures how long a vehicle takes to reach 60 mph from a standstill. It's the number carmakers, magazines and owners quote most because it matches what you feel every day: pulling away from lights, merging onto a highway and passing slower traffic.
Outside the US the benchmark is 0-100 km/h, which is 62.1 mph, so it usually runs a little longer than 0-60 mph for the same car.
- Under 3 sHypercar
- 3 to 4 sSupercar
- 4 to 5 sSports car
- 5 to 6.5 sQuick daily driver
- 6.5 to 8.5 sEveryday car
- Over 8.5 sRelaxed
What changes the real number
Traction
Power only helps if the tires can put it down. Wheelspin is the most common reason a real run is slower than the estimate.
Gearing and shifts
A shift just before 60 mph adds time. Dual-clutch gearboxes lose the least during a shift.
Launch technique
Launch control, clutch control and brake-torquing all change the first few feet.
Air and temperature
Hot, humid or high-altitude air cuts engine power, especially without a turbo.
Tires
Cold or worn tires grip less. Sticky summer tires and drag radials launch harder.
Load
Passengers, fuel and cargo add weight the spec sheet doesn't include.
Our estimates vs real road tests
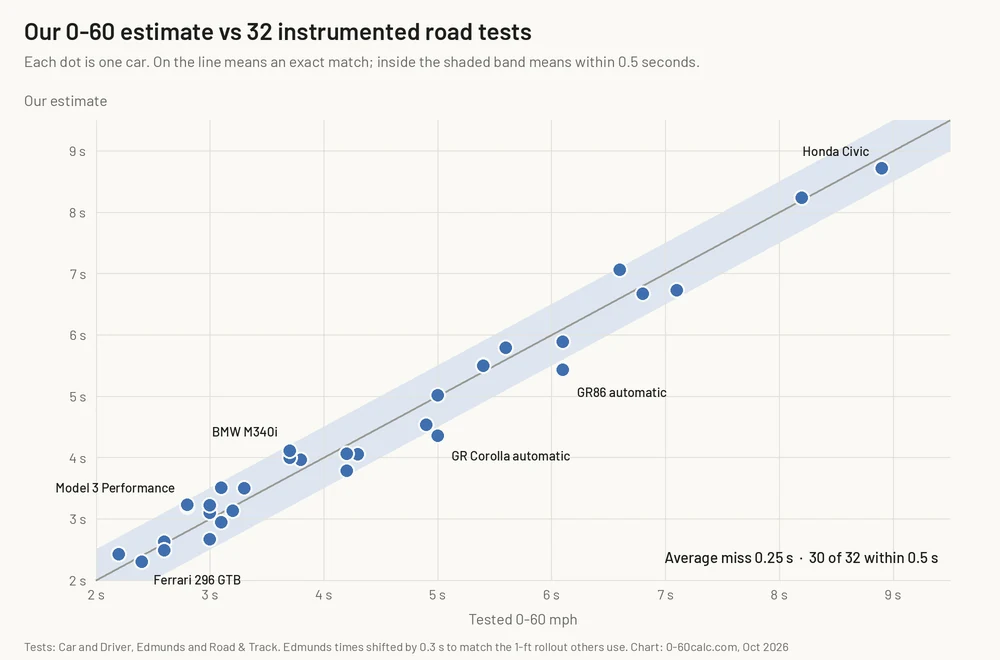
A calculator is only useful if you know how far to trust it. We ran 32 instrumented road tests through it, from a Honda Civic to a Ferrari 296 GTB, using each car’s rated horsepower and the curb weight the testers published, and compared the estimate with the measured 0-60 time.
| Car (as tested) | hp | Weight (lb) | Our estimate | Tested 0-60 |
|---|---|---|---|---|
| Honda Civic Sport (2025, CVT)Car and Driver (rollout subtracted) | 150 | 2,934 | 8.7 s | 8.9 s |
| Toyota RAV4 Limited AWD hybrid (2026)Car and Driver (rollout subtracted) | 236 | 3,875 | 6.7 s | 7.1 s |
| Mazda MX-5 Miata RF Club (2024, manual)Edmunds (no rollout) | 181 | 2,437 | 5.9 s | 6.4 s |
| Toyota GR86 (2022, automatic)Car and Driver (rollout subtracted) | 228 | 2,862 | 5.4 s | 6.1 s |
| Volkswagen Golf GTI (2025, dual-clutch)Car and Driver (rollout subtracted) | 241 | 3,293 | 5.8 s | 5.6 s |
| Toyota GR86 (2022, manual)Car and Driver (rollout subtracted) | 228 | 2,838 | 5.5 s | 5.4 s |
| Toyota GR Corolla (2025, automatic)Car and Driver (rollout subtracted) | 300 | 3,345 | 4.4 s | 5.0 s |
| Volkswagen Golf R (2025, dual-clutch)Edmunds (no rollout) | 328 | 3,376 | 4.1 s | 4.5 s |
| Ford Mustang GT (2024, manual)Car and Driver (rollout subtracted) | 486 | 3,947 | 3.8 s | 4.2 s |
| BMW M340i xDrive (2023, automatic)Car and Driver (rollout subtracted) | 382 | 3,988 | 4.1 s | 3.7 s |
| Chevrolet Corvette Stingray Z51 (2027, dual-clutch)Edmunds (no rollout) | 535 | 3,693 | 3.2 s | 3.3 s |
| Hyundai Ioniq 5 N (2025)Car and Driver (rollout subtracted) | 641 | 4,849 | 3.1 s | 3.0 s |
| Tesla Model 3 Performance (2024)Road & Track (as published) | 510 | 4,050 | 3.2 s | 2.8 s |
| Ferrari 296 GTB (2022, dual-clutch)Car and Driver (rollout subtracted) | 819 | 3,532 | 2.3 s | 2.4 s |
What the comparison shows. Across all 32 cars the estimate missed by 0.25 seconds on average, and 30 of the 32 landed within half a second. We fitted the formula’s constants to these same tests in October 2026, so the fairer number for a car that isn’t on the list comes from leaving each car out of the fit in turn and predicting it: that gave an average miss of about 0.3 seconds.
The misses follow a pattern. The estimate is too quick for the GR86 and GR Corolla with automatic gearboxes, which give away time at launch in a way a model built on gearbox type alone can’t see. It is too slow for some turbocharged cars with launch control, such as the BMW M340i, and for some electric cars, such as the Tesla Model 3 Performance, which launch harder than their power-to-weight ratio suggests. Treat the result as the middle of the range: half a second either way covers almost every car we tested.
Edmunds doesn’t subtract the first foot of travel the way Car and Driver and Road & Track do, so we took 0.3 seconds off its times before comparing; the table shows the times as published. Checked against published tests on 16 October 2026. See the fastest 0-60 cars for more tested times, or what counts as a good 0-60 time.
The formulas behind the estimate
The calculator starts from power-to-weight ratio, the strongest single predictor of acceleration, then adjusts for how the vehicle puts its power down. Nothing is hidden: these are the exact equations it runs.
0-60 mph
t = 0.608 × (W ÷ P)0.873 × D × G
Quarter-mile ET
ET = 5.825 × (W ÷ P)1/3
Trap speed
mph = 234 × (P ÷ W)1/3
- W, weight
- Pounds. Curb weight for 0-60; curb weight plus a 170 lb driver for the quarter mile.
- P, power
- Crank horsepower. Wheel horsepower is converted first.
- D, drivetrain
- Launch traction: RWD 1.00, FWD 0.99, AWD 0.89.
- G, gearbox
- Manual 1.00, automatic 0.98, dual-clutch 0.98, CVT 1.08. Electric cars use a single factor of 0.87 in place of D × G.
- Limits and calibration
- The constants were fitted in October 2026 to 32 instrumented road tests. No estimate goes below the traction limit: 1.8 s for AWD and EVs, 2.3 s for RWD, 2.8 s for FWD.
Worked example: 300 hp and 3,300 lb with RWD and a manual gives 0.608 × 11.00.873 = 4.9 s to 60 mph, and 13.17 s at 103.5 mph in the quarter mile.
How to use it
Pick the vehicle
Car, motorcycle or electric. The form shows only the inputs that apply.
Enter power and weight
Say whether the power figure is crank or wheel horsepower, and switch units if needed.
Set the layout
Choose drivetrain and gearbox. They decide how much power becomes forward motion.
Print and compare
Press Calculate, then change one input at a time to test a tune or an AWD swap.
Motorcycle 0-60: bikes launch differently
Motorcycles have huge power-to-weight ratios but can't use all of it off the line. One rear tire and the risk of a wheelie cap the launch, so the calculator adds the rider's weight and applies a 1.10 launch factor.
- Enter the bike's wet weight
- Crank horsepower, or rear-wheel horsepower from a dyno
- Rider weight with gear, or 170 lb if left blank
Example: a 200 hp superbike at 440 lb with a 170 lb rider estimates at 2.7 s to 60 mph and a 9.71 s quarter mile.
WHP to 0-60: using dyno numbers
Dyno sheets report wheel horsepower, the power left after the gearbox, driveshaft and differential take their share. Choose Wheel (WHP) and the calculator converts it to crank power first.
- RWD loss: 15%
- FWD loss: 12%, AWD loss: 20%
- Motorcycles and EVs: 10%
Example: 255 WHP on a RWD car is about 300 crank hp (255 ÷ 0.85). At 3,300 lb with a manual, that estimates at 4.9 s.
Quarter mile and 1/8 mile
The quarter mile shows how a vehicle keeps pulling long after 60 mph, and the 1/8 mile is the standard distance at many local strips. Real strips time several splits along the way; the calculator estimates the two that end a run.
- A 1/8 mile ET is roughly 64% of the quarter-mile ET
- 1/8 mile speed is roughly 80% of the quarter-mile trap speed
- Have a time slip already? The Quarter Mile Calculator works backwards from it to estimate horsepower
| Example build | 0-60 mph | 1/4 mile | Trap speed |
|---|---|---|---|
| Compact sedan158 hp, 2,900 lb, FWD, CVT | 8.2 s | 16.37 s | 87.0 mph |
| Hot hatch241 hp, 3,150 lb, FWD, dual-clutch | 5.6 s | 14.00 s | 97.6 mph |
| Sports coupe300 hp, 3,300 lb, RWD, manual | 4.9 s | 13.17 s | 103.5 mph |
| V8 coupe480 hp, 3,850 lb, RWD, manual | 3.7 s | 11.83 s | 115.2 mph |
| Dual-motor EV425 hp, 4,030 lb, AWD | 3.8 s | 11.59 s | 109.0 mph |
| Superbike200 hp, 440 lb plus rider | 2.7 s | 9.71 s | 153.3 mph |
Calculator estimates for example builds, not road-test results.
Sources and method
The 0-60 estimate starts from power-to-weight ratio and applies the drivetrain and gearbox factors shown in the formulas above; we refitted its constants in October 2026 to 32 instrumented road tests. Quarter-mile ET and trap speed use the power-to-weight formulas drag racer and engineer Patrick Hale published. We test the model against instrumented road tests and publish the misses as well as the hits.
- Our estimates compared with Car and Driver, Edmunds and Road & Track tests
- NIST Special Publication 811: unit conversion factors
Updated October 2026. Built and checked by the 0-60calc Team. Found a mistake? Tell us and we will check it against the source.
More calculators
Tools for the other numbers drivers ask about. Motorcycle, EV, wheel-horsepower and 0-100 km/h estimates are already built into the calculator above.
Quarter Mile Calculator
1/4 and 1/8 mile ET and trap speed, or work backwards from a time slip to horsepower.
OpenPower-to-Weight Ratio
lb/hp, kg/hp and hp per tonne, with a class comparison for cars and bikes.
OpenHorsepower Calculator
Convert torque and rpm to horsepower, or estimate power from ET, trap speed and weight.
OpenHP to Torque Calculator
Torque from horsepower and rpm, or horsepower from torque, with real engine figures.
OpenWHP to HP Calculator
Turn a dyno's wheel horsepower into crank horsepower and see the drivetrain loss.
OpenG-Force Calculator
Average acceleration in g from any 0-60 or 0-100 km/h time.
OpenTire Speed Rating Chart
Every speed rating letter in mph and km/h, plus a sidewall code decoder.
OpenTire Size Calculator
Compare two tire sizes: diameter, sidewall, revs per mile and speedometer error.
OpenKM/H to MPH Converter
Convert kilometers per hour to miles per hour, with a full chart.
OpenMPH to KM/H Converter
Convert miles per hour to kilometers per hour, with a full chart.
OpenSpeed Calculator
Speed, distance or time from the other two, average speed and speed from rpm.
OpenCC to HP Calculator
Estimate horsepower from engine displacement, or the cc you need for a power target.
OpenkW to HP Converter
Convert kilowatts to horsepower and PS, with a chart from 1 to 1,000 kW.
OpenHP to kW Converter
Convert horsepower to kilowatts, with real car ratings in both units.
Open1/8 to 1/4 Mile Calculator
Convert an eighth-mile ET and mph to a quarter-mile estimate, or back.
OpenGear Ratio Calculator
Road speed in every gear from rpm, cruising rpm, and what a gear or tire change does.
OpenPS to HP Converter
Convert metric horsepower (PS, CV) to hp, bhp and kW, with real European cars.
OpenNm to lb-ft Converter
Convert newton-meters to pound-feet for engine torque and bolt specs.
Openlb-ft to Nm Converter
Convert pound-feet to newton-meters for torque wrenches and lug nuts.
Open
Questions drivers ask
How accurate is a 0-60 calculator?
Close enough to trust as a ballpark. Against 32 instrumented road tests, our estimate missed by 0.25 seconds on average and landed within half a second for 30 of the 32 cars. Launch control, sticky tires and engines that make more than their rating can beat it, while wheelspin, heat and heavy loads make real runs slower.
Should I enter crank horsepower or wheel horsepower?
Use the figure you have and pick the matching option. Manufacturer ratings are crank horsepower. Dyno sheets usually show wheel horsepower (WHP), which the calculator converts using a typical drivetrain loss for your layout.
Why is my real 0-60 slower than the estimate?
Traction, shift time, hot or high-altitude air, passengers and worn tires all add time. Many published times also subtract a one-foot rollout, which trims roughly 0.2 to 0.3 seconds from what a stopwatch shows from a dead stop.
Does all-wheel drive always launch faster?
Off the line, usually yes, because all four tires share the power. The advantage fades at higher speeds, where the extra weight and drivetrain loss of AWD count against it.
How do I convert a 1/8 mile time to 0-60?
Enter your 1/8 mile time and weight in the Quarter Mile Calculator. It works back to an estimated horsepower, which you can then run through the 0-60 calculator above.
What counts as a fast 0-60 time?
Under 5 seconds is sports-car quick, under 4 seconds is supercar territory, and under 3 seconds puts a vehicle among hypercars and the quickest EVs and superbikes.